Ranked: The attendance at all 16 Super League Magic Weekends so far
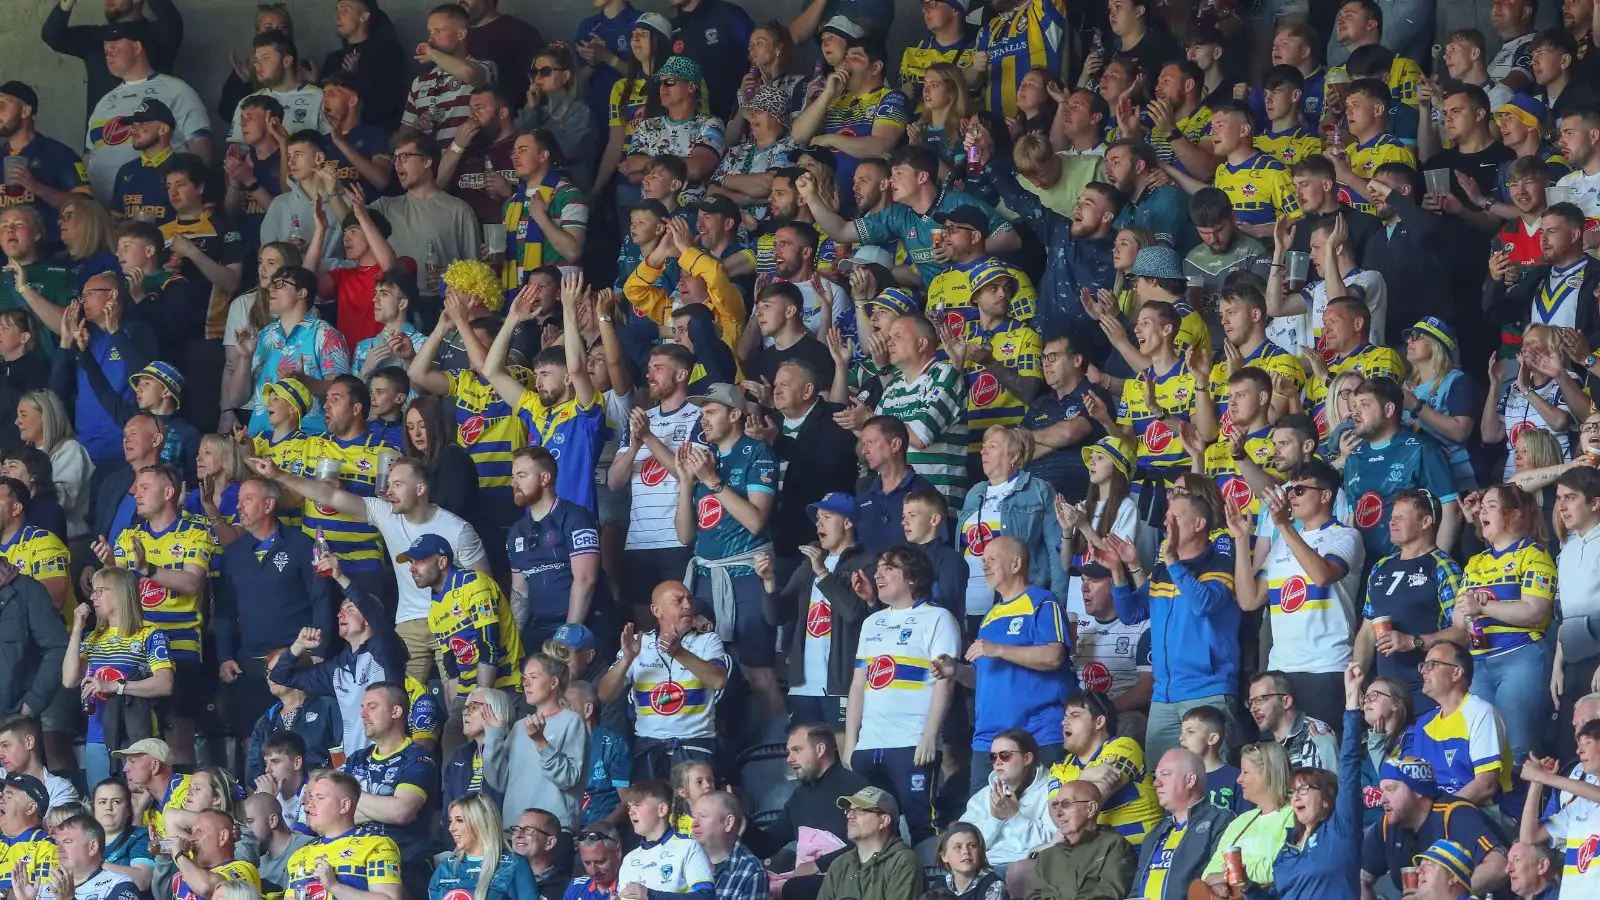
Warrington Wolves fans at the 2023 instalment of Super League's Magic Weekend - Alamy
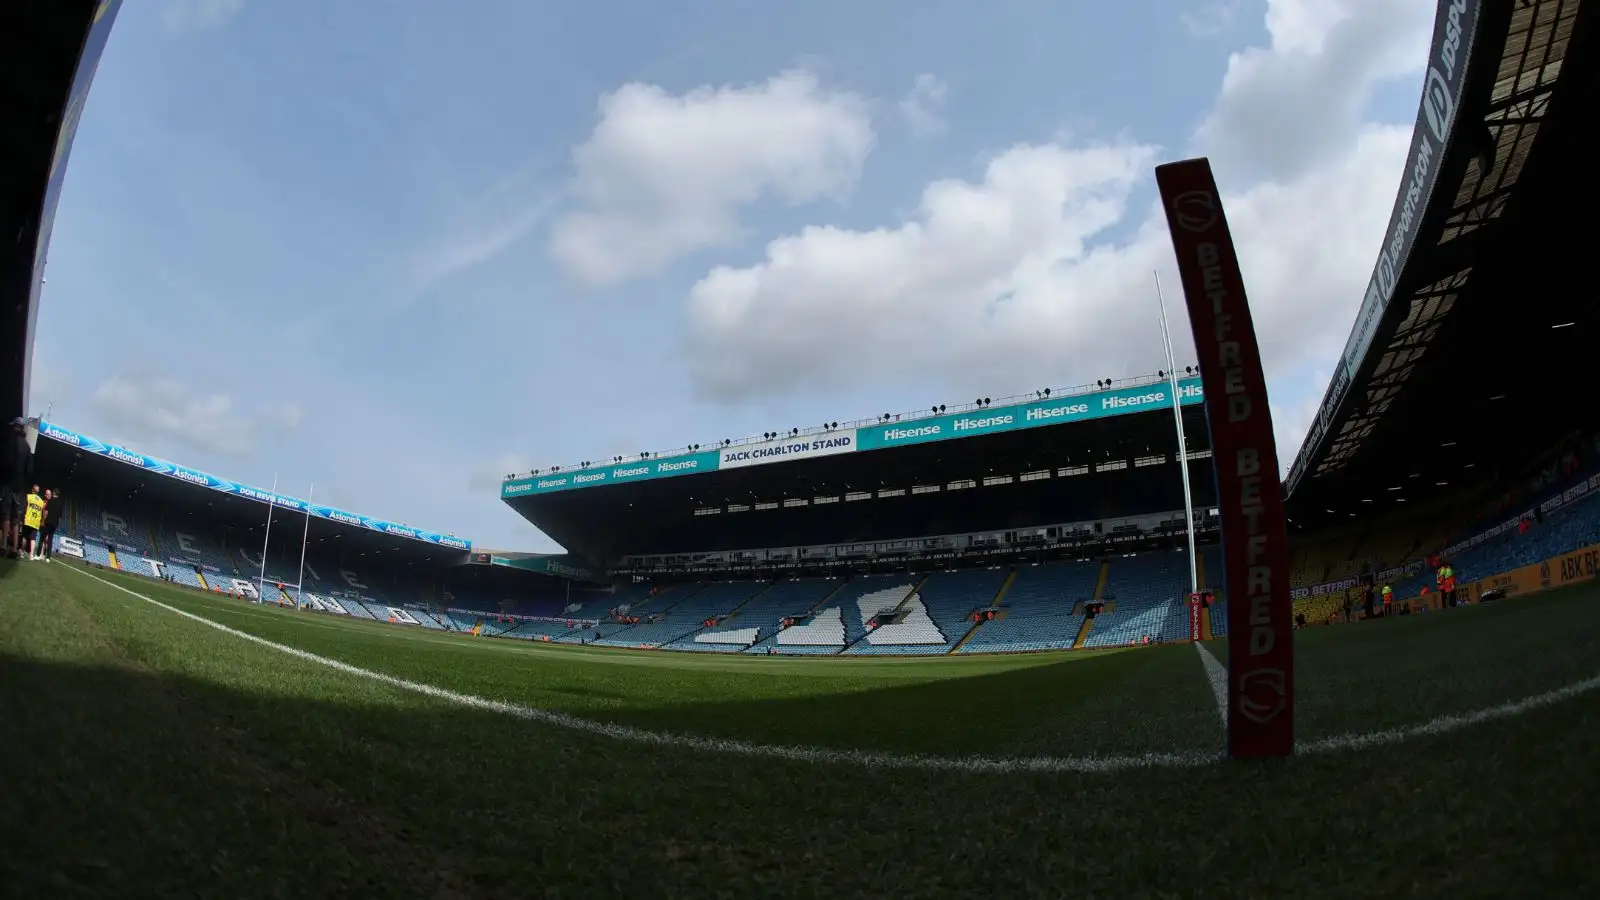
Elland Road will become the sixth different venue to host a Super League Magic Weekend come next August, and here, we’ve taken a look at what it has to live up to in terms of attendance.
It was confirmed earlier this afternoon that Leeds United’s home will host six Super League clashes over the weekend of August 17 & 18 in 2024.
Dubbed ‘one of the biggest and best stadia in the north of England’ by RL Commercial Director Rhodri Jones, the 37,792-capacity stadium last hosted a rugby league game this time last year, and it was a big one.
Reigning champions Australia reached the World Cup final with a pulsating 16-14 victory over New Zealand in the last-four, a spectacle watched by 28,113 on a cold Friday night.
Even if that tally was doubled over the course of the Magic Weekend next August, it would still be the second-worst attended instalment of the event to date, only beating the 52,043 of Murrayfield, Edinburgh in 2010.
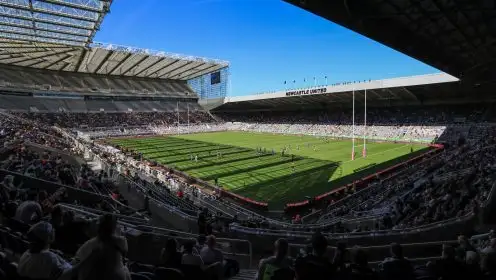
The Millennium Stadium (Cardiff), the Etihad Stadium (Manchester), Anfield (Liverpool) and St James’ Park (Newcastle) are the other four venues to have played host to ‘Magic’ since its inception in 2007, with a steady increase over each of the last three years in the North East.
An overall attendance of 68,276 in 2016 at St James’ Park is the event’s greatest success to date. To put all of this into context, if every single seat was taken at Elland Road over both days next August, the attendance would be 75,584.
A full list of the 16 Magic Weekend instalments so far, with venue, year and overall attendance are ranked from worst to best below. 2020 is the only year since 2007 that the event didn’t take place, and that was due to the start of the COVID-19 Pandemic.
Ranked: The attendance at every Super League Magic Weekend so far as Elland Road named sixth different host venue
From lowest to highest:
16. 52,043 – 2010 (Edinburgh)
15. 56,869 – 2019 (Liverpool)
14. 58,831 – 2007 (Cardiff)
13. 59,749 – 2009 (Edinburgh)
12. 60,214 – 2011 (Cardiff)
11. 60,866 – 2021 (Newcastle)
10. 62,042 – 2013 (Manchester)
9. 62,154 – 2022 (Newcastle)
8. 63,144 – 2008 (Cardiff)
7. 63,269 – 2023 (Newcastle)
6. 63,716 – 2012 (Manchester)
5. 64,319 – 2018 (Newcastle)
4. 64,552 – 2014 (Manchester)
3. 65,407 – 2017 (Newcastle)
2. 67,841 – 2015 (Newcastle)
1. 68,276 – 2016 (Newcastle)
READ NEXT: Opinion Piece – 63,269 reasons why Magic Weekend shouldn’t be scrapped
